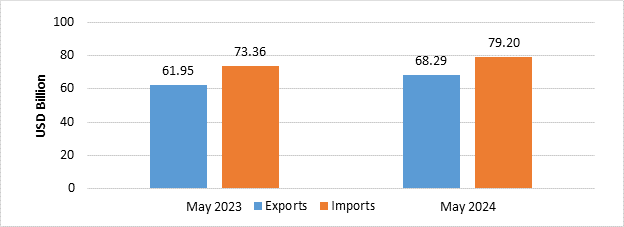
India’s total exports (Merchandise and Services combined) for May 2024* is estimated at USD 68.29 Billion, registering a positive growth of 10.25 percent vis-à-vis May 2023.Total imports (Merchandise and Services combined) for May 2024* is estimated at USD 79.20 Billion, registering a positive growth of 7.95 percent vis-à-vis May 2023.
Table 1: Trade during May 2024*
| May 2024
(USD Billion) |
May 2023
(USD Billion) |
||
| Merchandise | Exports | 38.13 | 34.95 |
| Imports | 61.91 | 57.48 | |
| Services* | Exports | 30.16 | 26.99 |
| Imports | 17.28 | 15.88 | |
| Total Trade
(Merchandise +Services) * |
Exports | 68.29 | 61.95 |
| Imports | 79.20 | 73.36 | |
| Trade Balance | -10.90 | -11.41 |
* Note: The latest data for services sector released by RBI is for April2024. The data for May 2024 is an estimation, which will be revised based on RBI’s subsequent release.
Fig 1: Total Trade during May 2024*
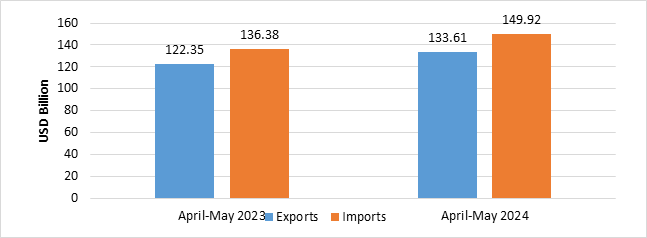
India’s total exports during April-May2024* is estimated at USD 133.61 Billion registering a positive growth of 9.21 percent. Total imports during April-May 2024* is estimated at USD 149.92 Billion registering a growth of 9.93 percent.
Table 2: Trade during April-May 2024*
| April-May 2024
(USD Billion) |
April-May 2023
(USD Billion) |
||
| Merchandise | Exports | 73.12 | 69.57 |
| Imports | 116.01 | 106.54 | |
| Services* | Exports | 60.49 | 52.77 |
| Imports | 33.91 | 29.84 | |
| Total Trade
(Merchandise +Services) * |
Exports | 133.61 | 122.35 |
| Imports | 149.92 | 136.38 | |
| Trade Balance | -16.31 | -14.03 |
Fig 2: Total Trade during April-May 2024*
MERCHANDISE TRADE
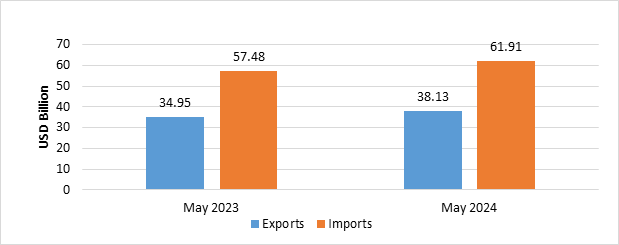
- Merchandise exports during May 2024 were USD 38.13 Billion as compared to USD 34.95 Billion in May 2023.
- Merchandise imports during May 2024 were USD 61.91 Billion as compared to USD 57.48 Billion in May 2023.
Fig 3: Merchandise Trade during May 2024
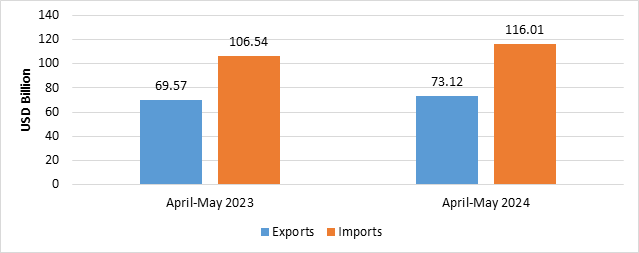
- Merchandise exports during April-May 2024 were USD 73.12 Billion as compared to USD 69.57Billion during April-May 2023.
- Merchandise imports during April-May 2024 were USD 116.01 Billion compared to USD 106.54 Billion during April-May 2023.
- Merchandise trade deficit during April-May 2024 was USD 42.89 Billion compared to USD 36.97 Billion during April-May 2023.
Fig4: Merchandise Trade during April-May 2024
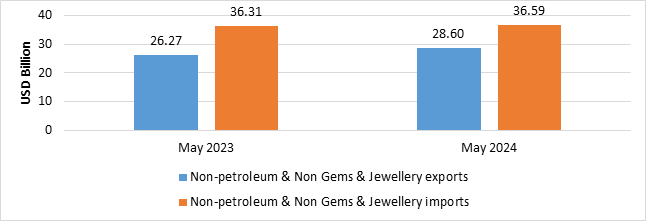
- Non-petroleum and non-gems & jewellery exports in May 2024 were USD 28.60Billion compared to USD 26.27Billion in May 2023.
- Non-petroleum, non-gems & jewellery (gold, silver & precious metals) imports in May 2024 were USD 36.59Billion compared to USD 36.31Billion in May 2023.
Table 3: Trade excluding Petroleum and Gems &Jewellery during May 2024
May 2024(USD Billion) |
May 2023
(USD Billion) |
|
| Non- petroleum exports | 31.36 | 29.10 |
| Non- petroleum imports | 41.97 | 41.91 |
| Non-petroleum &Non-Gems & Jewellery exports | 28.60 | 26.27 |
| Non-petroleum &Non-Gems & Jewellery imports | 36.59 | 36.31 |
Note: Gems &Jewellery Imports include Gold, Silver & Pearls, precious & Semi-precious stones
Fig 5: Trade excluding Petroleum and Gems &Jewellery during May 2024
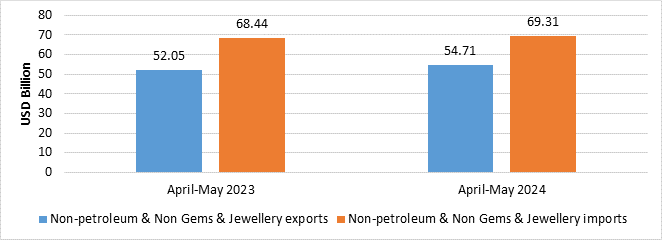
- Non-petroleum and non-gems & jewellery exports in April-May 2024 were USD 54.71 Billion, compared to USD 52.05 Billion in April-May 2023.
- Non-petroleum, non-gems & jewellery (gold, silver & precious metals) imports in April-May 2024 were USD 69.31 Billion, compared to USD 68.44 Billion in April-May 2023.
Table 4: Trade excluding Petroleum and Gems &Jewellery during April-May 2024
April-May 2024(USD Billion) |
April-May 2023
(USD Billion) |
|
| Non- petroleum exports | 59.73 | 57.30 |
| Non- petroleum imports | 79.60 | 77.27 |
| Non-petroleum &Non Gems & Jewellery exports | 54.71 | 52.05 |
| Non-petroleum &Non Gems & Jewellery imports | 69.31 | 68.44 |
Note: Gems & Jewellery Imports include Gold, Silver & Pearls, precious & Semi-precious stones
Fig 6: Trade excluding Petroleum and Gems & Jewellery during April-May 2024
SERVICES TRADE
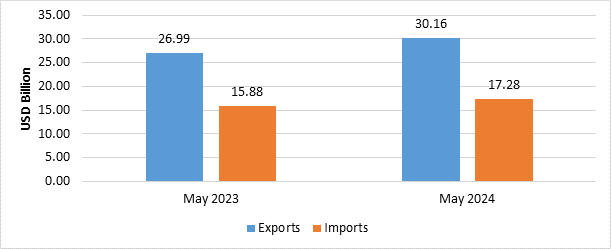
- The estimated value of services export for May 2024* is USD 30.16 Billion as compared to USD 26.99Billion in May 2023.
- The estimated value of services imports for May 2024* is USD 17.28 Billion as compared to USD 15.88Billion in May 2023.
Fig 7: Services Trade during May 2024*
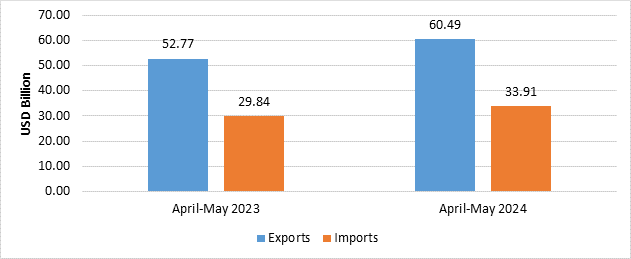
- The estimated value of service exports during April-May 2024* is USD 60.49 Billion as compared to USD 52.77 Billion in April-May 2023.
- The estimated value of service imports during April-May 2024* is USD 33.91 Billion as compared to USD 29.84 Billion in April-May 2023.
- The services trade surplus for April-May 2024* is USD 26.58 Billion as compared to USD 22.94 Billion in April-May 2023.
Fig 8: Services Trade during April-May 2024*
Exports of Coffee (64.23%), Tobacco (58.38%), Electronic Goods (22.97%), Meat, dairy & poultry products (22.95%), Fruits & Vegetables (20.75%), Handicrafts excl. handmade carpet (20.63%), Tea (19.57%), Carpet (17.55%), Plastic & Linoleum (16.6%), Petroleum Products (15.75%), Cereal preparations & miscellaneous processed items (14.31%), Drugs & Pharmaceuticals (10.45%), RMG of all Textiles (9.84%), Cotton Yarn/Fabs./made-ups, Handloom Products etc. (9.75%), Engineering Goods (7.39%), Oil seeds (5.75%), Man-made Yarn/Fabs./made-ups etc. (4.65%), Organic & Inorganic Chemicals (3.21%), Rice (2.76%) and Mica, Coal & Other Ores, Minerals including processed minerals (1.08%) record positive growth during May 2024 over the corresponding month of last year.
Imports of Project goods (-44.31%), Coal, Coke & Briquettes, etc.(-26.55%),Cotton Raw & Waste(-24.46%),Sulphur & Unroasted Iron Pyrts(-20.92%), Fertilisers, Crude & manufactured(-20.42%), Leather & leather products(-20.05%), Chemical material & products (-9.81%), Gold (-9.76%), Wood & Wood products(-7.2%),Iron & Steel (-6.65%),Dyeing/tanning/colouring mtrls.(-5.1%),Newsprint(-4.49%), Textile yarn Fabric, made-up articles(-1.15%) and Organic & Inorganic Chemicals(-0.49%) record negative growth during May 2024 over the corresponding month of last year.
Services exports is estimated to grow by 14.63percent during April-May 2024* over April-May 2023.
Top 5 export destinations, in terms of change in value, exhibiting positive growth in May 2024 vis a vis May 2023 are U S A (13.06%), Netherland (43.92%), U Arab Emts (19.43%), Malaysia (86.95%) and U K (33.54%).
Top 5 export destinations, in terms of change in value, exhibiting positive growth in April-May 2024 vis a vis April-May 2023 are U S A (12.66%), Netherland (40.87%), U Arab Emts (16.16%), Singapore (36.65%) and Malaysia (64.03%).
Top 5 import sources, in terms of change in value, exhibiting growth in May 2024 vis a vis May 2023 are U Arab Emts (49.93%), Iraq (58.68%), Russia (18.02%), Angola (1274.95%) and Indonesia (23.36%).
Top 5 import sources, in terms of change in value, exhibiting growth in April-May 2024 vis a vis April-May2023 are Russia (19.89%), U Arab Emts (28.83%), Iraq (34.12%), Switzerland (26.43%) and Angola (256.01%).
QUICK ESTIMATES FOR SELECTED MAJOR COMMODITIES FOR MAY 2024
TRADE: EXPORT
| Sl. No. | Commodities | Values in Million USD | % Change | ||||
| MAY’23 | APR’23-MAY’23 | MAY’24 | APR’24-MAY’24 | MAY’24 | APR’24-MAY’24 | ||
| 1 | Tea | 54.07 | 101.82 | 64.66 | 124.70 | 19.57 | 22.47 |
| 2 | Coffee | 112.97 | 231.44 | 185.54 | 322.80 | 64.23 | 39.48 |
| 3 | Rice | 977.28 | 1977.53 | 1004.29 | 1956.36 | 2.76 | -1.07 |
| 4 | Other cereals | 104.45 | 167.98 | 19.37 | 41.58 | -81.45 | -75.25 |
| 5 | Tobacco | 91.27 | 196.12 | 144.56 | 263.26 | 58.38 | 34.24 |
| 6 | Spices | 453.07 | 814.37 | 361.17 | 766.79 | -20.28 | -5.84 |
| 7 | Cashew | 28.17 | 55.25 | 20.91 | 43.23 | -25.79 | -21.75 |
| 8 | Oil Meals | 150.98 | 349.47 | 113.00 | 246.22 | -25.16 | -29.54 |
| 9 | Oil seeds | 103.85 | 239.99 | 109.82 | 222.54 | 5.75 | -7.27 |
| 10 | Fruits & Vegetables | 245.10 | 558.37 | 295.97 | 589.12 | 20.75 | 5.51 |
| 11 | Cereal preparations & miscellaneous processed items | 230.77 | 464.74 | 263.79 | 509.45 | 14.31 | 9.62 |
| 12 | Marine Products | 599.27 | 1166.89 | 575.84 | 1070.03 | -3.91 | -8.30 |
| 13 | Meat, dairy & poultry products | 307.75 | 647.93 | 378.37 | 699.81 | 22.95 | 8.01 |
| 14 | Iron Ore | 288.90 | 643.75 | 268.76 | 414.63 | -6.97 | -35.59 |
| 15 | Mica, Coal & Other Ores, Minerals including processed minerals | 382.48 | 773.46 | 386.60 | 727.79 | 1.08 | -5.90 |
| 16 | Leather & leather products | 369.18 | 695.97 | 361.31 | 664.62 | -2.13 | -4.51 |
| 17 | Ceramic products & glassware | 373.07 | 736.78 | 360.19 | 700.17 | -3.45 | -4.97 |
| 18 | Gems &Jewellery | 2823.14 | 5248.45 | 2759.94 | 5017.83 | -2.24 | -4.39 |
| 19 | Drugs & Pharmaceuticals | 2084.06 | 4346.03 | 2301.88 | 4730.66 | 10.45 | 8.85 |
| 20 | Organic & Inorganic Chemicals | 2237.01 | 4375.35 | 2308.75 | 4805.17 | 3.21 | 9.82 |
| 21 | Engineering Goods | 9300.75 | 18250.12 | 9988.43 | 18653.96 | 7.39 | 2.21 |
| 22 | Electronic Goods | 2414.22 | 4521.83 | 2968.66 | 5619.97 | 22.97 | 24.29 |
| 23 | Cotton Yarn/Fabs./made-ups, Handloom Products etc. | 919.88 | 1807.70 | 1009.61 | 1956.46 | 9.75 | 8.23 |
| 24 | Man-made Yarn/Fabs./made-ups etc. | 395.43 | 788.36 | 413.82 | 782.17 | 4.65 | -0.79 |
| 25 | RMG of all Textiles | 1235.81 | 2446.66 | 1357.40 | 2555.79 | 9.84 | 4.46 |
| 26 | Jute Mfg. including Floor Covering | 30.38 | 63.79 | 28.79 | 55.91 | -5.21 | -12.36 |
| 27 | Carpet | 111.23 | 216.40 | 130.75 | 241.84 | 17.55 | 11.76 |
| 28 | Handicrafts excl. handmade carpet | 123.37 | 245.46 | 148.82 | 273.82 | 20.63 | 11.55 |
| 29 | Petroleum Products | 5854.37 | 12274.93 | 6776.29 | 13390.59 | 15.75 | 9.09 |
| 30 | Plastic & Linoleum | 650.79 | 1297.65 | 758.81 | 1424.76 | 16.60 | 9.79 |
| Sub-Total | 33053.08 | 65704.59 | 35866.10 | 68872.03 | 8.51 | 4.82 | |
| GRAND TOTAL | 34952.48 | 69570.93 | 38132.48 | 73116.68 | 9.10 | 5.10 | |
Note 1: Exports include Re-Exports.
Note 2: The figures for MAY’24 are provisional.
Note 3: Grand total is inclusive of component ‘Other
QUICK ESTIMATES FOR SELECTED MAJOR COMMODITIES FOR MAY 2024
TRADE: EXPORT
| Sl. No. |
Commodities |
Values in Rs Crore | % Change | ||||
| MAY’23 | APR’23-MAY’23 | MAY’24 | APR’24-MAY’24 | MAY’24 | APR’24-MAY’24 | ||
| 1 | Tea | 445.25 | 836.89 | 539.19 | 1040.01 | 21.10 | 24.27 |
| 2 | Coffee | 930.24 | 1901.90 | 1547.24 | 2692.12 | 66.33 | 41.55 |
| 3 | Rice | 8047.28 | 16251.37 | 8375.09 | 16315.86 | 4.07 | 0.40 |
| 4 | Other cereals | 860.11 | 1381.16 | 161.57 | 346.74 | -81.21 | -74.89 |
| 5 | Tobacco | 751.53 | 1611.53 | 1205.49 | 2195.58 | 60.40 | 36.24 |
| 6 | Spices | 3730.72 | 6694.10 | 3011.91 | 6395.04 | -19.27 | -4.47 |
| 7 | Cashew | 232.00 | 454.08 | 174.37 | 360.57 | -24.84 | -20.59 |
| 8 | Oil Meals | 1243.20 | 2871.27 | 942.30 | 2053.48 | -24.20 | -28.48 |
| 9 | Oil seeds | 855.11 | 1971.80 | 915.79 | 1855.98 | 7.10 | -5.87 |
| 10 | Fruits & Vegetables | 2018.26 | 4587.71 | 2468.14 | 4913.20 | 22.29 | 7.09 |
| 11 | Cereal preparations & miscellaneous processed items | 1900.26 | 3819.29 | 2199.82 | 4248.76 | 15.76 | 11.24 |
| 12 | Marine Products | 4934.62 | 9590.24 | 4802.14 | 8923.96 | -2.68 | -6.95 |
| 13 | Meat, dairy & poultry products | 2534.13 | 5324.32 | 3155.34 | 5836.33 | 24.51 | 9.62 |
| 14 | Iron Ore | 2378.90 | 5289.43 | 2241.24 | 3457.93 | -5.79 | -34.63 |
| 15 | Mica, Coal & Other Ores, Minerals including processed minerals | 3149.48 | 6356.28 | 3224.00 | 6069.73 | 2.37 | -4.51 |
| 16 | Leather & leather products | 3039.94 | 5720.31 | 3013.07 | 5542.82 | -0.88 | -3.10 |
| 17 | Ceramic products & glassware | 3071.95 | 6055.14 | 3003.69 | 5839.36 | -2.22 | -3.56 |
| 18 | Gems &Jewellery | 23246.67 | 43139.29 | 23015.97 | 41848.08 | -0.99 | -2.99 |
| 19 | Drugs & Pharmaceuticals | 17160.82 | 35713.69 | 19196.08 | 39453.54 | 11.86 | 10.47 |
| 20 | Organic & Inorganic Chemicals | 18420.26 | 35959.11 | 19253.38 | 40074.95 | 4.52 | 11.45 |
| 21 | Engineering Goods | 76585.46 | 149988.87 | 83296.39 | 155572.11 | 8.76 | 3.72 |
| 22 | Electronic Goods | 19879.48 | 37166.23 | 24756.49 | 46870.06 | 24.53 | 26.11 |
| 23 | Cotton Yarn/Fabs./made-ups, Handloom Products etc. | 7574.63 | 14856.58 | 8419.45 | 16316.75 | 11.15 | 9.83 |
| 24 | Man-made Yarn/Fabs./made-ups etc. | 3256.08 | 6478.96 | 3450.98 | 6523.21 | 5.99 | 0.68 |
| 25 | RMG of all Textiles | 10176.08 | 20107.55 | 11319.73 | 21315.07 | 11.24 | 6.01 |
| 26 | Jute Mfg. including Floor Covering | 250.12 | 524.21 | 240.12 | 466.25 | -4.00 | -11.06 |
| 27 | Carpet | 915.91 | 1778.54 | 1090.33 | 2016.96 | 19.04 | 13.41 |
| 28 | Handicrafts excl. handmade carpet | 1015.87 | 2017.24 | 1241.04 | 2283.61 | 22.17 | 13.20 |
| 29 | Petroleum Products | 48206.79 | 100868.75 | 56509.45 | 111676.65 | 17.22 | 10.71 |
| 30 | Plastic & Linoleum | 5358.82 | 10664.45 | 6327.96 | 11882.33 | 18.08 | 11.42 |
| Sub-Total | 272170.00 | 539980.30 | 299097.77 | 574387.07 | 9.89 | 6.37 | |
| GRAND TOTAL | 287810.22 | 571753.51 | 317997.81 | 609787.03 | 10.49 | 6.65 | |
Note 1: Grand total is inclusive of component ‘Other’.
Note 2: The figures for MAY’24 are provisional.
QUICK ESTIMATES FOR SELECTED MAJOR COMMODITIES FOR MAY 2024
TRADE: IMPORT
| Sl. No. | Commodities | Values in Million USD | % Change | ||||
| MAY’23 | APR’23-MAY’23 | MAY’24 | APR’24-MAY’24 | MAY’24 | APR’24-MAY’24 | ||
| 1 | Cotton Raw & Waste | 58.09 | 103.39 | 43.88 | 81.79 | -24.46 | -20.89 |
| 2 | Vegetable Oil | 1140.09 | 2218.38 | 1453.12 | 2790.55 | 27.46 | 25.79 |
| 3 | Pulses | 131.84 | 282.79 | 370.91 | 781.99 | 181.34 | 176.53 |
| 4 | Fruits & vegetables | 218.28 | 417.87 | 224.80 | 479.60 | 2.99 | 14.77 |
| 5 | Pulp and Waste paper | 136.50 | 283.04 | 167.90 | 311.22 | 23.01 | 9.96 |
| 6 | Textile yarn Fabric, made-up articles | 188.24 | 349.50 | 186.08 | 347.92 | -1.15 | -0.45 |
| 7 | Fertilisers, Crude & manufactured | 1180.48 | 1831.76 | 939.37 | 1536.57 | -20.42 | -16.12 |
| 8 | Sulphur & Unroasted Iron Pyrites | 6.59 | 28.89 | 5.21 | 11.51 | -20.92 | -60.14 |
| 9 | Metaliferrous ores & other minerals | 925.04 | 1483.98 | 966.33 | 1557.61 | 4.46 | 4.96 |
| 10 | Coal, Coke & Briquettes, etc. | 4492.28 | 7998.80 | 3299.74 | 6395.68 | -26.55 | -20.04 |
| 11 | Petroleum, Crude & products | 15574.12 | 29267.92 | 19948.63 | 36411.05 | 28.09 | 24.41 |
| 12 | Wood & Wood products | 581.68 | 1119.50 | 539.77 | 1001.69 | -7.20 | -10.52 |
| 13 | Leather & leather products | 95.04 | 156.66 | 75.98 | 138.07 | -20.05 | -11.87 |
| 14 | Organic & Inorganic Chemicals | 2561.36 | 4894.29 | 2548.81 | 4754.82 | -0.49 | -2.85 |
| 15 | Dyeing/tanning/colouring materials | 354.07 | 688.19 | 336.03 | 661.35 | -5.10 | -3.90 |
| 16 | Artificial resins, plastic materials, etc. | 1883.78 | 3782.11 | 1888.33 | 3591.90 | 0.24 | -5.03 |
| 17 | Chemical material & products | 1057.05 | 2044.72 | 953.30 | 1865.00 | -9.81 | -8.79 |
| 18 | Newsprint | 39.72 | 63.85 | 37.94 | 65.09 | -4.49 | 1.94 |
| 19 | Pearls, precious & Semi-precious stones | 1878.65 | 3986.89 | 1909.50 | 3572.58 | 1.64 | -10.39 |
| 20 | Iron & Steel | 1824.30 | 3530.95 | 1703.00 | 3269.02 | -6.65 | -7.42 |
| 21 | Non-ferrous metals | 2047.76 | 3816.11 | 2070.52 | 3848.63 | 1.11 | 0.85 |
| 22 | Machine tools | 397.19 | 726.64 | 445.82 | 846.00 | 12.24 | 16.43 |
| 23 | Machinery, electrical & non-electrical | 4138.33 | 8069.01 | 4148.68 | 7940.30 | 0.25 | -1.60 |
| 24 | Transport equipment | 2341.05 | 4486.76 | 3087.28 | 5227.74 | 31.88 | 16.51 |
| 25 | Project goods | 56.78 | 88.97 | 31.62 | 69.35 | -44.31 | -22.05 |
| 26 | Professional instrument, Optical goods, etc. | 628.86 | 1205.43 | 643.79 | 1269.67 | 2.37 | 5.33 |
| 27 | Electronic goods | 6702.87 | 13111.28 | 7149.18 | 14200.43 | 6.66 | 8.31 |
| 28 | Medicinal & Pharmaceutical products | 702.49 | 1279.88 | 763.43 | 1447.01 | 8.67 | 13.06 |
| 29 | Gold | 3693.47 | 4701.47 | 3333.03 | 6447.66 | -9.76 | 37.14 |
| 30 | Silver | 27.15 | 140.04 | 137.93 | 272.07 | 407.99 | 94.28 |
| Sub-Total | 55063.15 | 102159.08 | 59409.91 | 111193.87 | 7.89 | 8.84 | |
| GRAND TOTAL | 57481.42 | 106537.53 | 61914.33 | 116009.84 | 7.71 | 8.89 | |
Note 1: Imports include Re-Imports.
Note 2: The figures for MAY’24 are provisional.
Note 3: Grand total is inclusive of component ‘Other’.
QUICK ESTIMATES FOR SELECTED MAJOR COMMODITIES FOR MAY 2024
TRADE: IMPORT
| Sl. No. | Commodities | Values in Rs Crore | % Change | ||||
| MAY’23 | APR’23-MAY’23 | MAY’24 | APR’24-MAY’24 | MAY’24 | APR’24-MAY’24 | ||
| 1 | Cotton Raw & Waste | 478.35 | 849.89 | 365.90 | 682.10 | -23.51 | -19.74 |
| 2 | Vegetable Oil | 9387.85 | 18232.11 | 12118.03 | 23273.01 | 29.08 | 27.65 |
| 3 | Pulses | 1085.59 | 2323.72 | 3093.09 | 6521.73 | 184.92 | 180.66 |
| 4 | Fruits & vegetables | 1797.41 | 3434.43 | 1874.66 | 3999.84 | 4.30 | 16.46 |
| 5 | Pulp and Waste paper | 1123.97 | 2325.90 | 1400.13 | 2595.54 | 24.57 | 11.59 |
| 6 | Textile yarn Fabric, made-up articles | 1550.03 | 2872.74 | 1551.75 | 2901.58 | 0.11 | 1.00 |
| 7 | Fertilisers, Crude & manufactured | 9720.49 | 15062.35 | 7833.71 | 12814.69 | -19.41 | -14.92 |
| 8 | Sulphur & Unroasted Iron Pyrites | 54.25 | 237.16 | 43.44 | 96.02 | -19.93 | -59.51 |
| 9 | Metaliferrous ores & other minerals | 7617.10 | 12201.53 | 8058.49 | 12990.14 | 5.79 | 6.46 |
| 10 | Coal, Coke & Briquettes, etc. | 36990.90 | 65751.67 | 27517.52 | 53339.54 | -25.61 | -18.88 |
| 11 | Petroleum, Crude & products | 128242.46 | 240560.06 | 166357.38 | 303663.80 | 29.72 | 26.23 |
| 12 | Wood & Wood products | 4789.71 | 9200.97 | 4501.34 | 8354.01 | -6.02 | -9.21 |
| 13 | Leather & leather products | 782.59 | 1288.02 | 633.63 | 1151.50 | -19.03 | -10.60 |
| 14 | Organic & Inorganic Chemicals | 21091.10 | 40225.98 | 21255.23 | 39654.66 | 0.78 | -1.42 |
| 15 | Dyeing/tanning/colouring materials | 2915.53 | 5656.03 | 2802.26 | 5515.65 | -3.89 | -2.48 |
| 16 | Artificial resins, plastic materials, etc. | 15511.64 | 31081.93 | 15747.30 | 29956.09 | 1.52 | -3.62 |
| 17 | Chemical material & products | 8704.07 | 16805.03 | 7949.83 | 15553.92 | -8.67 | -7.44 |
| 18 | Newsprint | 327.11 | 525.02 | 316.41 | 542.88 | -3.27 | 3.40 |
| 19 | Pearls, precious & Semi-precious stones | 15469.46 | 32761.41 | 15923.88 | 29795.00 | 2.94 | -9.05 |
| 20 | Iron & Steel | 15021.87 | 29019.93 | 14201.85 | 27263.41 | -5.46 | -6.05 |
| 21 | Non-ferrous metals | 16861.94 | 31366.05 | 17266.69 | 32097.20 | 2.40 | 2.33 |
| 22 | Machine tools | 3270.61 | 5972.79 | 3717.80 | 7055.56 | 13.67 | 18.13 |
| 23 | Machinery, electrical & non-electrical | 34076.37 | 66316.12 | 34597.05 | 66221.42 | 1.53 | -0.14 |
| 24 | Transport equipment | 19276.98 | 36876.28 | 25745.71 | 43598.39 | 33.56 | 18.23 |
| 25 | Project goods | 467.56 | 731.57 | 263.65 | 578.35 | -43.61 | -20.94 |
| 26 | Professional instrument, Optical goods, etc. | 5178.21 | 9907.35 | 5368.77 | 10589.02 | 3.68 | 6.88 |
| 27 | Electronic goods | 55193.68 | 107755.96 | 59619.12 | 118430.73 | 8.02 | 9.91 |
| 28 | Medicinal & Pharmaceutical products | 5784.53 | 10520.35 | 6366.50 | 12067.99 | 10.06 | 14.71 |
| 29 | Gold | 30413.23 | 38680.91 | 27795.08 | 53772.97 | -8.61 | 39.02 |
| 30 | Silver | 223.58 | 1149.48 | 1150.21 | 2268.98 | 414.45 | 97.39 |
| Sub-Total | 453408.16 | 839692.71 | 495436.41 | 927345.74 | 9.27 | 10.44 | |
| GRAND TOTAL | 473321.02 | 875683.13 | 516321.52 | 967510.51 | 9.08 | 10.49 | |
Note 1: Grand total is inclusive of component ‘Other’.
Note 2: The figures for MAY’24 are provisional.
QUICK ESTIMATES FOR SELECTED COUNTRIES FOR MAY 2024
TRADE: EXPORT
| Sl. No. | Countries | (Values in Million USD) | % Change | ||||
| MAY’23 | APR’23-MAY’23 | MAY’24 | APR’24-MAY’24 | MAY’24 | APR’24-MAY’24 | ||
| 1 | U S A | 6573.41 | 12467.43 | 7432.21 | 14045.46 | 13.06 | 12.66 |
| 2 | U ARAB EMTS | 2568.17 | 4791.93 | 3067.14 | 5566.35 | 19.43 | 16.16 |
| 3 | NETHERLAND | 1522.98 | 3264.45 | 2191.83 | 4598.54 | 43.92 | 40.87 |
| 4 | U K | 1029.22 | 2146.36 | 1374.43 | 2620.39 | 33.54 | 22.09 |
| 5 | CHINA P RP | 1284.91 | 2673.96 | 1327.99 | 2581.58 | 3.35 | -3.45 |
| 6 | SINGAPORE | 977.09 | 1824.50 | 1022.38 | 2493.13 | 4.64 | 36.65 |
| 7 | SAUDI ARAB | 1034.76 | 1969.05 | 1122.29 | 2072.78 | 8.46 | 5.27 |
| 8 | BANGLADESH PR | 862.77 | 1719.15 | 978.96 | 1784.74 | 13.47 | 3.82 |
| 9 | GERMANY | 811.67 | 1607.95 | 866.38 | 1641.96 | 6.74 | 2.12 |
| 10 | FRANCE | 529.03 | 1060.44 | 724.46 | 1488.79 | 36.94 | 40.39 |
| 11 | MALAYSIA | 424.74 | 901.36 | 794.06 | 1478.49 | 86.95 | 64.03 |
| 12 | SOUTH AFRICA | 703.32 | 1431.02 | 677.94 | 1389.59 | -3.61 | -2.90 |
| 13 | ITALY | 860.01 | 1716.42 | 689.60 | 1372.91 | -19.82 | -20.01 |
| 14 | NEPAL | 678.74 | 1337.99 | 607.73 | 1197.87 | -10.46 | -10.47 |
| 15 | BRAZIL | 634.57 | 1276.62 | 667.38 | 1152.87 | 5.17 | -9.69 |
| 16 | TURKEY | 585.72 | 1247.56 | 681.43 | 1136.12 | 16.34 | -8.93 |
| 17 | BELGIUM | 733.36 | 1308.08 | 472.94 | 1047.29 | -35.51 | -19.94 |
| 18 | MEXICO | 441.66 | 853.36 | 512.69 | 999.50 | 16.08 | 17.13 |
| 19 | AUSTRALIA | 538.18 | 1259.39 | 519.25 | 956.55 | -3.52 | -24.05 |
| 20 | HONG KONG | 487.07 | 1013.19 | 518.38 | 928.15 | 6.43 | -8.39 |
| Sub-Total | 23281.40 | 45870.21 | 26249.47 | 50553.05 | 12.75 | 10.21 | |
| GRAND TOTAL | 34952.48 | 69570.93 | 38132.48 | 73116.68 | 9.10 | 5.10 | |
Note 1: Grand total is inclusive of all countries.
Note 2: The figures for MAY’24 are provisional.
QUICK ESTIMATES FOR SELECTED COUNTRIES FOR MAY 2024
TRADE: IMPORT
| Sl. No. | Countries | (Values in Million USD) | % Change | ||||
| MAY’23 | APR’23-MAY’23 | MAY’24 | APR’24-MAY’24 | MAY’24 | APR’24-MAY’24 | ||
| 1 | CHINA P RP | 8250.12 | 15750.29 | 8482.59 | 16276.97 | 2.82 | 3.34 |
| 2 | RUSSIA | 6022.50 | 10307.80 | 7107.75 | 12358.18 | 18.02 | 19.89 |
| 3 | U ARAB EMTS | 3493.28 | 6642.07 | 5237.55 | 8556.70 | 49.93 | 28.83 |
| 4 | U S A | 3761.54 | 6818.76 | 3776.69 | 6983.76 | 0.40 | 2.42 |
| 5 | IRAQ | 2369.81 | 4625.93 | 3760.46 | 6204.50 | 58.68 | 34.12 |
| 6 | SAUDI ARAB | 2501.24 | 5613.21 | 2398.53 | 5591.29 | -4.11 | -0.39 |
| 7 | INDONESIA | 1950.79 | 3710.33 | 2406.55 | 4281.00 | 23.36 | 15.38 |
| 8 | SWITZERLAND | 2250.04 | 2945.99 | 1522.61 | 3724.72 | -32.33 | 26.43 |
| 9 | KOREA RP | 1594.66 | 3189.11 | 1806.73 | 3352.57 | 13.30 | 5.13 |
| 10 | SINGAPORE | 1501.47 | 3051.37 | 1633.29 | 3202.70 | 8.78 | 4.96 |
| 11 | JAPAN | 1552.49 | 3059.08 | 1549.97 | 3039.38 | -0.16 | -0.64 |
| 12 | GERMANY | 1819.30 | 3244.40 | 1296.08 | 2502.57 | -28.76 | -22.87 |
| 13 | HONG KONG | 1355.82 | 2438.56 | 1306.96 | 2428.74 | -3.60 | -0.40 |
| 14 | QATAR | 956.75 | 2013.00 | 1245.48 | 2315.09 | 30.18 | 15.01 |
| 15 | SOUTH AFRICA | 1015.09 | 1714.66 | 1125.75 | 2140.04 | 10.90 | 24.81 |
| 16 | AUSTRALIA | 1450.62 | 2503.03 | 998.42 | 1997.20 | -31.17 | -20.21 |
| 17 | MALAYSIA | 1027.77 | 1869.54 | 993.92 | 1969.25 | -3.29 | 5.33 |
| 18 | THAILAND | 850.23 | 1773.29 | 875.40 | 1811.10 | 2.96 | 2.13 |
| 19 | TAIWAN | 605.62 | 1244.25 | 882.77 | 1778.04 | 45.76 | 42.90 |
| 20 | KUWAIT | 743.94 | 1405.90 | 933.21 | 1566.58 | 25.44 | 11.43 |
| Sub-Total | 45073.07 | 83920.59 | 49340.72 | 92080.38 | 9.47 | 9.72 | |
| GRAND TOTAL | 57481.42 | 106537.53 | 61914.33 | 116009.84 | 7.71 | 8.89 | |
Note 1: Grand total is inclusive of all countries.
Note 2: The figures for MAY’24 are provisional.